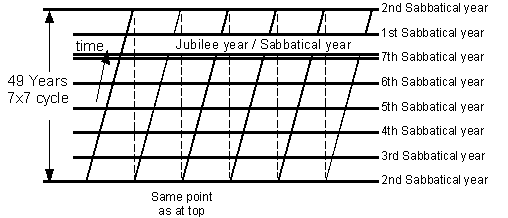
Understanding the Jubilee Chart Construction
The Jubilee chart is a plot of time in the vertical axis versus the number of Jubilee cycles in the horizontal axis.
Jubilee (49 year cycle) Chart Construction: To get a better understanding of how the Jubilee chart is constructed, picture a time line in the form of a string. This string is wound around a cardboard tube, much like around a screw. Each time the timeline string goes around the tube, 49 years goes by. The string is glued to the tube, and then the tube is cut open lengthwise and spread out. The cut and opened strings form slanted lines representing 49 years each. A point at the top of a slanted line is the same as the point at the bottom of the slanted line to its right. The bold or heavier horizontal lines indicate sabbatical years, which occur every 7 years as well as the first year (or fiftieth year) of the 49 year cycle.

The Jubilee cycle is a 7 x 7 cycle with the 50th year being the same as the 1st year of the next cycle. The veracity of the 49 year cycle (as opposed to a 50 year cycle) was confirmed by the release of the previously unpublished Dead Sea Scrolls by the Huntington Library / Claremont College of California.
The bolder lines are the Sabbatical years, occuring every 7 years and the 1st/50th years. Thus there are 8 Sabbatical years every Jubilee cycle.
Back to the Dating Creation paper - Back to the Kings of the North & South paper